Customer and Sales analytics dashboard decision planning to analyze company’s performance for a global coffee chain

Overview
Our client, one of the world’s largest coffeehouse chains wanted a one stop tool to quickly track their sales, transactions, new registrations, customer base across different regions, district, cities and sales channel for different time periods and compare their performances across different time periods which can help the client in taking strategic decisions.
Solution
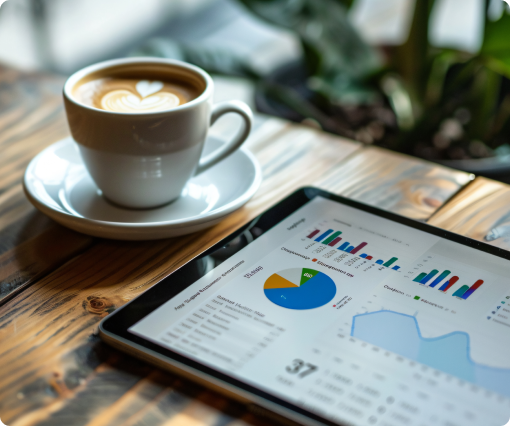
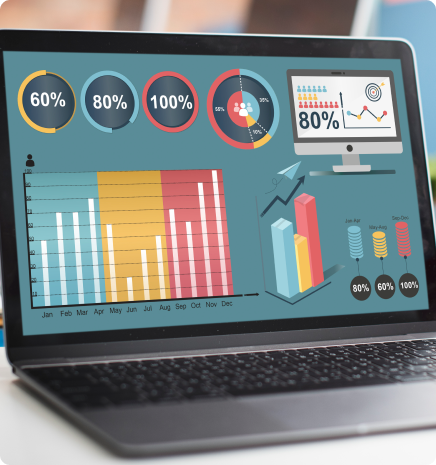
TransOrg developed customer and sales analytics dashboard for strategic and decision planning and track and analyze company’s performance in past and to take strategic decision in future.
- Gathered the required POS and customer data tables for the dashboard using Azure Synapse,
- Data cleaning, transformation and modeling performed in the dashboard for smooth functioning of the visualizations.
- Measures have been created using DAX for different KPIs(Revenue%, Transactions%, AT, Frequency) and charts as per business requirement.
- Dynamic set of time filter is created to track sales metrics on yearly, monthly, weekly and daily basis.
- Comparison functionality is created to track percentage change in sales metrics across different time periods.
- Sales metrics have been analysed in different regions, district, cities using decision tree visualization.
- Row level security is applied on the dashboard to provide access based on their position in the organisation.
- Incremental refresh for automatic update of the dashboard on daily basis have been provided
For Customer Lifetime Value (CLV) modelling, there were many methodologies that deal with the portion of CLV associated with direct purchases, but the two most broad classes are generally defined as: –
- Historical CLV
- Predictive CLV
TransOrg used predictive modelling approach where, it segmented the problem statement into two parts. Here CLV was defined as combination of two things which were purchase visit frequency and average order value.

Impacts
Manual process of tracking sales metrics and sharing it to the client every week, month and quarter have been replaced with one dashboard to track all the metrics in an efficient and automated manner.
Client can track all business KPIs for 300+ stores in 40 cities for all sales channel in a single dashboard .
All store managers, region managers, district managers and other positions in organization have been provided access based on their positions.

